Test of GridSpec
Contents
Test of GridSpec#
import numpy as np
import matplotlib.pyplot as plt
from matplotlib.gridspec import GridSpec
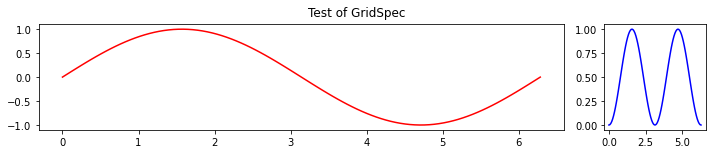
Just one row, but two unequal sized subplots#
Four total equal-spaced columns. Use the first three for the left plot and the final one for the right plot.
# sample data for plots
x_pts = np.linspace(0., 2.*np.pi, 100)
y_pts = np.sin(x_pts)
fig = plt.figure(figsize=(10,2))
fig.suptitle('Test of GridSpec', va='baseline')

num_rows = 1   # rows in grid
num_cols = 5   # columns in grid
gs = GridSpec(num_rows, num_cols)  # create a GridSpec object called gs

ax_left = fig.add_subplot(gs[0,0:4]) # row 0, span columns 0, 1, 2
ax_right = fig.add_subplot(gs[0,4])  # row 0, column 3 only

ax_left.plot(x_pts, y_pts, color='red')
ax_right.plot(x_pts, y_pts**2, color='blue')

fig.tight_layout()
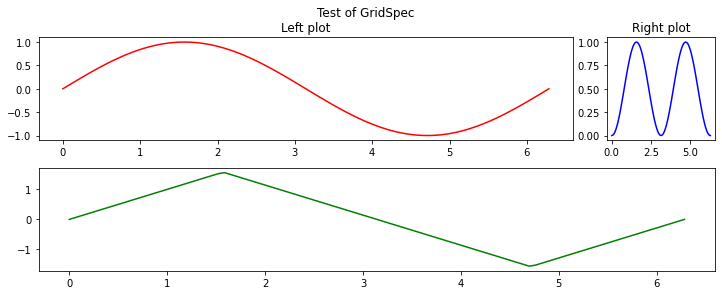
Try adding another row#
fig = plt.figure(figsize=(10,4))   # add some more vertical room
fig.suptitle('Test of GridSpec', va='baseline')

num_rows = 2   # rows in grid
num_cols = 5   # columns in grid
gs = GridSpec(num_rows, num_cols)  # create a GridSpec object called gs

ax_left = fig.add_subplot(gs[0,0:4]) # row 0, span columns 0, 1, 2
ax_right = fig.add_subplot(gs[0,4])  # row 0, column 3 only
ax_bottom = fig.add_subplot(gs[1,0:5]) # row 1, space columns 0 to 3

ax_left.plot(x_pts, y_pts, color='red')
ax_right.plot(x_pts, y_pts**2, color='blue')
ax_bottom.plot(x_pts, np.arcsin(y_pts), color='green')

ax_left.set_title('Left plot')
ax_right.set_title('Right plot')
fig.tight_layout()