Plotting every period and printing tables
Plotting every period and printing tables#
import numpy as np
import matplotlib.pyplot as plt
def start_stop_indices(t_pts, plot_start, plot_stop):
    """Return the indices in the array t_pts that are closed to the values
        of plot_start and plot_stop.  We use this for plots versus time
        but it is clearly applies to any array of floats.
    """
    start_index = (np.fabs(t_pts-plot_start)).argmin()  # index in t_pts array
    stop_index = (np.fabs(t_pts-plot_stop)).argmin()  # index in t_pts array
    return start_index, stop_index
omega_ext = 1.2
tau = 2.*np.pi / omega_ext
t_start = 0.
t_end = 100. * tau # 100 periods > what we need for any plot
delta_index = 50 # no. of steps per period
delta_t = tau / delta_index
t_pts = np.arange(t_start, t_end+delta_t, delta_t) # or use np.linspace
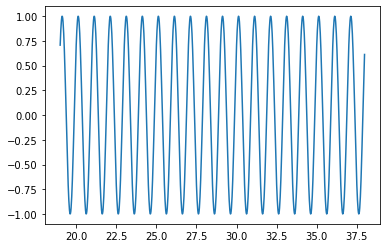
x_pts = np.sin(omega_ext * t_pts + np.pi/4.)
start, stop = start_stop_indices(t_pts, 19.*tau, 38.*tau)

fig = plt.figure()
ax = fig.add_subplot(1,1,1)
ax.plot(t_pts[start:stop]/tau, x_pts[start:stop])
[<matplotlib.lines.Line2D at 0x114fab6a0>]
for t, x in zip(t_pts[start:stop:delta_index] / tau,
                x_pts[start:stop:delta_index]):
    print(f'  {t:.2f}  {x: .5f}')
  19.00   0.70711
  20.00   0.70711
  21.00   0.70711
  22.00   0.70711
  23.00   0.70711
  24.00   0.70711
  25.00   0.70711
  26.00   0.70711
  27.00   0.70711
  28.00   0.70711
  29.00   0.70711
  30.00   0.70711
  31.00   0.70711
  32.00   0.70711
  33.00   0.70711
  34.00   0.70711
  35.00   0.70711
  36.00   0.70711
  37.00   0.70711